While real estate activity has already picked up, it’s an opportune time to discuss the housing market’s seasonality trends. Seasonality refers to predictable changes in time series data that correlate with certain times of the year (read more on seasonality). Looking at seasonality trends will enhance our understanding of what we might anticipate in the upcoming months.
The housing market exhibits notable seasonality trends that can significantly impact both buying and selling activities. While these trends can vary by area, some patterns can be generally observed across the United States. Understanding these trends and how they might affect the supply and demand of homes can help buyers find better deals, and sellers list their homes when demand is highest.
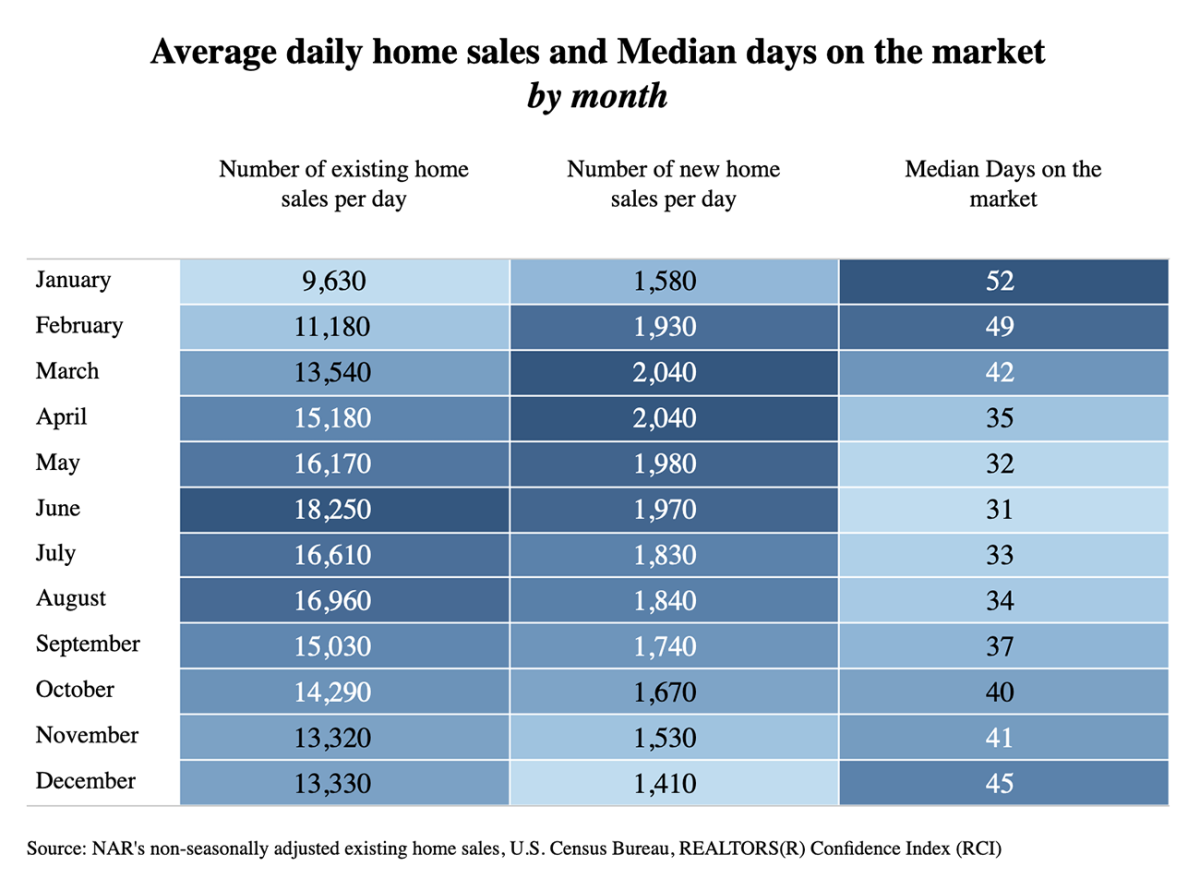
Let’s take a look at how many existing and new homes are typically sold per day each month.
Peak buying season
- Timing: April through June
- Average number of existing homes sold per day: 16,530
- Average number of new homes sold per day: 2,000
- Median days on the market: 33 days
The market experiences a surge in activity, reaching its peak in June. Warmer weather and the end of the school year encourage more people to buy and sell, respectively. Buyers are looking to move and settle before the new school year begins, contributing to increased competition and, consequently, higher prices. During these months, more than 16,500 existing homes are sold within a day across the country, while home sales exceed 18,000 homes per day in June. Home prices follow the same trend, as homes are 16% more expensive in June compared to the winter months (December-February).
However, data shows that new home sales are less sensitive to seasonality compared to existing-home sales. While new homes are sold before they are fully constructed, there is also a continuous flow of new homes onto the market, not just during the traditional spring and summer buying seasons. These two factors help ease the seasonality effect in new home sales.
Sellers: Higher demand during the spring season often means sellers can ask for higher prices. Homes also tend to sell faster during this peak season. Specifically, the median days on the market goes down to 31 days in June compared to 49 days during December through February.
Buyers: Although there are more homes available for sale, the market is more competitive during these three months, with multiple offers and bidding wars becoming the norm for desirable properties.
High activity continues but begins to slow
- Timing: July through September
- Average number of existing homes sold per day: 16,200
- Average number of new homes sold per day: 1,810
- Median days on the market: 35 days
Activity remains strong, but the market starts to cool off gradually after reaching its peak in June. Considering that families try to settle before the school year starts, the market cools off further as the season progresses. During these three months, while more than 16,000 existing and 1,800 new homes are sold every day on average respectively across the country, activity is about 2 percentage points lower than the spring peak season.
Sellers: It’s still a good time to sell due to the strong demand during this season.
Buyers: Although competition remains high, data shows that it starts to ease toward the end of the summer, leading to slightly better negotiating power and more opportunities for buyers. The median days on the market increases to 37 days in September.
Market slows, more opportunities for buyers
- Timing: October through November
- Average number of existing homes sold per day: 13,810
- Average number of new homes sold per day: 1,600
- Median days on the market: 41 days
As the weather cools, the market slows further. This translates to fewer buyers in the market, resulting in less competition and a drop in prices. Specifically, the typical home is about 5% less expensive compared to June.
For sellers: Although there are fewer buyers in the market, these are serious buyers actively seeking to purchase a property and are usually ready and able to commit when they find the right property.
For buyers: Less competition can lead to better deals. While homes are not selling as fast as during the summer, sellers may be more willing to negotiate.
Lowest activity, but more opportunities for negotiations for buyers
- Timing: December through February
- Average number of existing homes sold per day: 11,380
- Average number of new homes sold per day: 1,640
- Median days on the market: 49 days
During this period, the market is at its slowest due to the holidays and cold weather. Both buyers and sellers are less active, leading to the lowest competition levels of the year. The median days on the market increases to nearly 50 days from 30 days during the peak buying season.
For sellers: Selling in winter can be challenging, but while fewer homes are available for sale, sellers might benefit from less competition in the market during this period.
For buyers: Buyers have more negotiating power as homes stay longer on the market. It takes 49 days to sell the typical home in the U.S.
Regional Variations
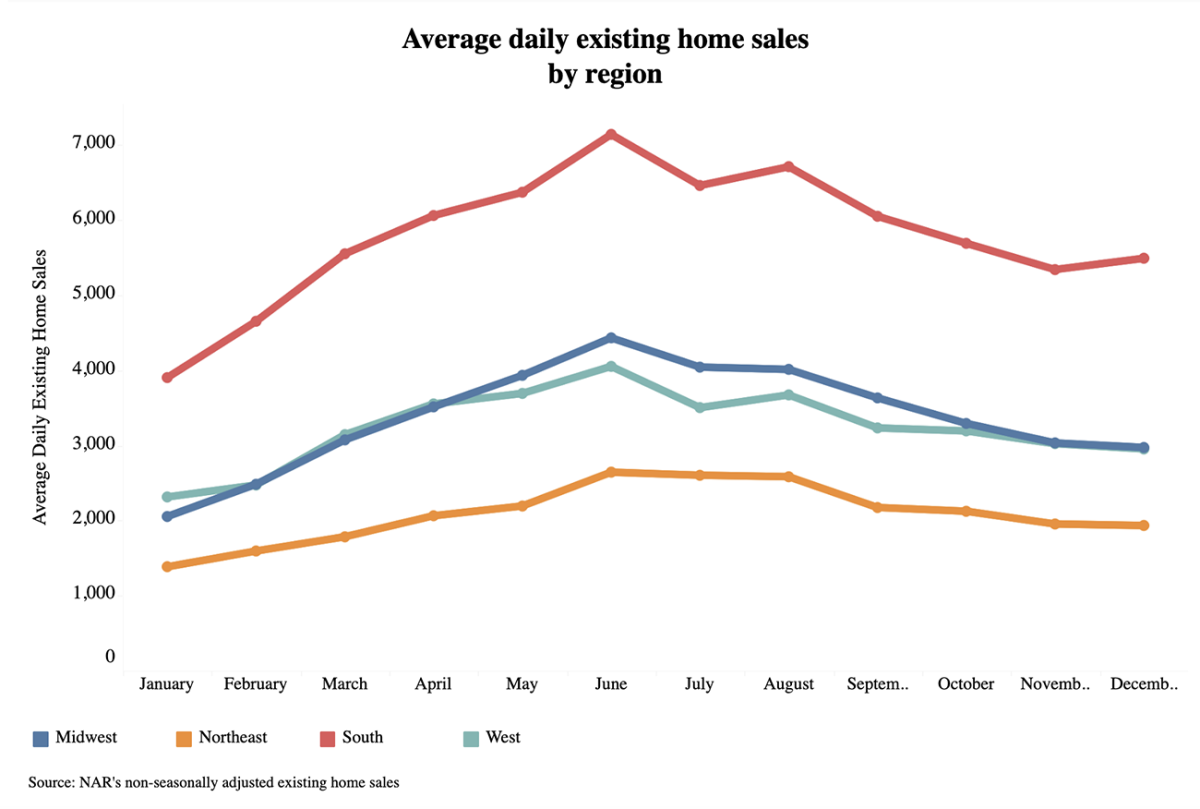
However, it’s important to note that these trends can vary significantly by region. For instance, in warmer areas, the winter slowdown is typically less pronounced. Additionally, in areas with heavy tourism, such as many areas in the South, seasonal trends may be influenced by second-home buyers. For example, in the Midwest, twice as many homes are sold in June (4,430 home sales per day on average) compared to the winter months, with January (2,050 home sales per day on average) seeing the lowest level of home sales in this region. The West is the region that is least affected by seasonality. Market activity advances during the spring and summer months, but the fluctuations are not as high as in the other regions.


